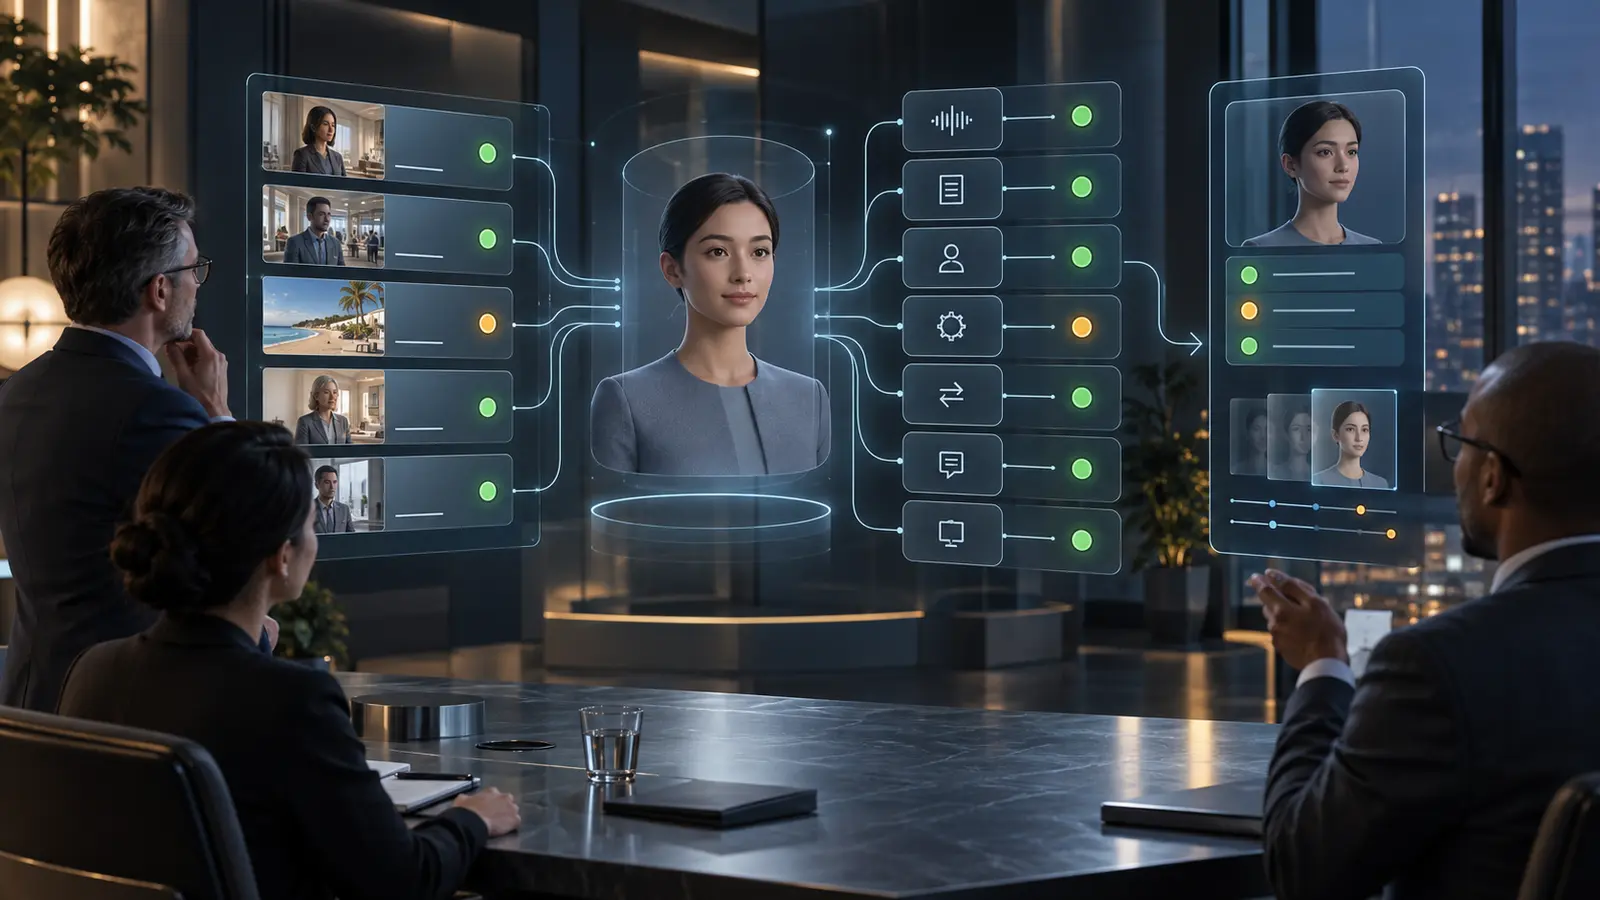
AI Inference Energy Use: Measure Power per Conversation
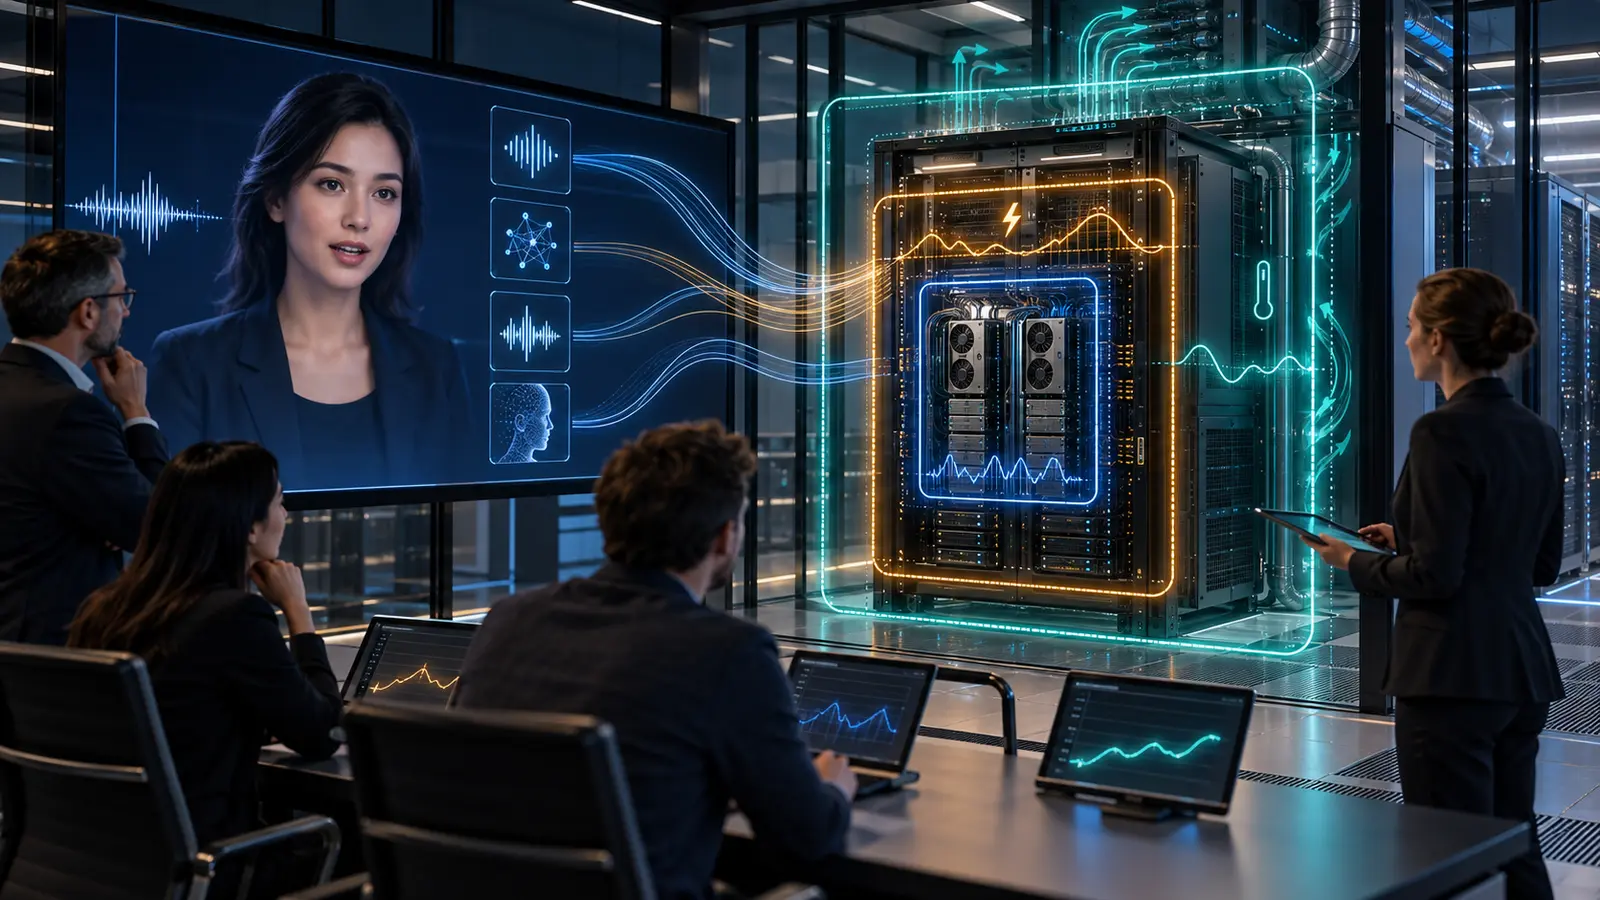
AI inference energy consumption should be measured at three boundaries: the accelerator, the complete system at the wall and the facility that powers and cools it. None is a substitute for the others. GPU telemetry can show where a model is inefficient, wall measurement captures the host, memory, networking and fans, and facility measurement reveals the extra energy needed for cooling and power distribution.
For a real-time AI avatar, divide that energy by a useful outcome: a successful conversation completed within its latency, accuracy, safety, voice and visual-quality thresholds. Watts per GPU or energy per token can support diagnosis, but neither tells a bank or government team how much power a working citizen or customer service actually requires.
Separate power, energy and emissions
These terms answer different planning questions.
- Power, measured in watts or kilowatts, is the rate of consumption at a moment in time. Peak power determines whether the rack, power distribution unit, uninterruptible power supply and cooling path can support the service.
- Energy, measured in watt-hours or kilowatt-hours, accumulates power over time. It is useful for operating cost, capacity scenarios and efficiency comparisons.
- Carbon emissions depend on the energy consumed and the generation mix attributed to that place and time. A lower-energy system will often reduce operational emissions, but energy and carbon are not interchangeable measures.
An average-power result can conceal a short peak that trips a limit. A low peak can coexist with poor energy efficiency if the system remains warm and idle for long periods. Procurement therefore needs both maximum demand and energy over a representative operating window.
Use a three-boundary measurement model
1. Accelerator telemetry
Collect GPU utilisation, memory use, board power, total energy where available, temperature, clocks and throttle reasons. These signals help identify whether speech recognition, the language model, voice synthesis or avatar rendering is driving demand. NVIDIA’s Data Center GPU Manager, for example, supports GPU telemetry, health monitoring and power and clock management.
This is component evidence, not a facility bill. Device readings do not necessarily include the host CPU, memory, storage, network interfaces, media encoders, fans, power-supply losses or other accelerators.
2. Complete-system input power
Measure the electrical input to the defined system under test. The boundary may be one server, a rack or a dedicated appliance, but it must be stated. MLCommons’ power methodology measures inference power at the wall and includes the components exercised by the workload, such as processors, accelerators, memory and fans. It also requires power and performance to come from the same run rather than combining the best result from separate tests.
That principle is useful outside formal benchmarking: timestamp the energy trace and the avatar workload together so every latency, error and completed conversation can be reconciled with the power window that produced it.
3. Facility power and cooling
The server converts most consumed electricity into heat. The deployment must also supply power distribution, cooling, monitoring and resilience. Where the facility has a measured power usage effectiveness or an equivalent allocation method, record its scope and period. Do not multiply server energy by a generic industry number and present the result as measured fact.
Facility planning also needs heat density and peak conditions. A rack can stay within its electrical budget while producing a hot spot that causes clock throttling, fan escalation or reduced component life. For critical services, the design must still work during the intended failure state—for example, after losing one cooling path or one inference node.
Define the workload before measuring it
Energy results are meaningful only when the work is comparable. Create a workload contract that records:
- the number of sessions, arrival pattern and concurrency;
- conversation and turn duration, including silence and interruptions;
- languages, audio conditions and input modalities;
- model, prompt, knowledge, policy, voice and renderer versions;
- response length, tool calls and retrieved context;
- frame rate, resolution, captions and media-delivery settings;
- quality, safety and latency thresholds for a successful conversation;
- idle, warm-pool and shutdown behaviour before and after the run.
A short text-only prompt is not representative of an avatar that listens continuously, retrieves private knowledge, generates speech, renders expressions and maintains a real-time media session. Use the same representative journeys described in Yepic’s guide to end-to-end AI load testing.
Test four operating states
Idle
Measure the service while available but carrying no conversations. Include loaded models, health checks, media relays and reserved workers. Idle demand matters when a private service must remain ready around the clock.
Representative steady load
Run the normal mix of concurrent sessions for long enough to stabilise clocks, fans and temperatures. Report average power, total energy, completed conversations and quality failures.
Burst and capacity knee
Increase arrivals until queueing, tail latency or quality begins to degrade. Capture peak input power and the number of admitted sessions. This connects the energy test to the GPU capacity plan rather than treating power as a separate sustainability exercise.
Thermal soak and failover
Hold a demanding but permitted workload long enough to reveal thermal saturation, clock reduction, memory growth or cooling imbalance. Then exercise the intended failover state. A redundant design that exceeds the remaining power or cooling envelope during a failure is not genuinely resilient.
Report energy per successful conversation
Keep the raw measures and the outcome measure. A useful report contains peak wall power, average wall power, total wall energy, GPU telemetry, inlet and exhaust temperature, throttle events, session concurrency, tail latency, error rate and successful conversations.
Gross energy per successful conversation is the complete system energy consumed during the test window divided by conversations that met every acceptance threshold. It represents the cost of keeping that measured system available during the window.
Incremental energy per successful conversation subtracts a separately measured idle baseline for an equivalent window before dividing by successful conversations. It can help compare model or runtime changes, but it must not replace the gross figure when sizing the facility or estimating an always-on service.
Do not count failed or abandoned sessions as free. If a power-saving change increases timeouts, unsafe replies or unusable audio, its apparent energy efficiency is misleading. MLCommons similarly couples energy with a defined performance run; its current datacentre benchmark reports whole-system power or energy per stream depending on the scenario.
Use an energy evidence record
For every test and production baseline, retain one record containing:
- system boundary and physical location;
- hardware, firmware, drivers, runtime and model versions;
- workload-contract and evaluation-set versions;
- meter, telemetry source, sampling interval and time synchronisation;
- power-management, clock, fan and cooling settings;
- idle, average and peak power plus total energy;
- facility factor and its evidence, if applied;
- temperature, throttling and failure-state observations;
- successful conversations and gross and incremental energy per success;
- approver, exceptions, rollback point and retest triggers.
Retest after a model, precision, driver, kernel, renderer, media setting, power policy or hardware change. Yesterday’s guide to AI model quantisation explains why a smaller representation does not automatically produce lower latency or energy on every runtime and GPU.
Choose efficiency controls without breaking the conversation
- Right-size each model. Use the smallest component that meets the domain and language thresholds, not one model size for every request.
- Validate lower precision. Quantisation can reduce memory traffic and compute, but compatibility and quality must be tested on the target hardware.
- Control the warm pool. Too few ready workers increase cold-start delay; too many raise idle energy. Schedule against observed arrivals and recovery requirements.
- Batch selectively. Batching may improve accelerator utilisation, but waiting to form a batch can damage turn-taking latency. Real-time speech and rendering may need different policies from retrieval or offline work.
- Test power caps and clock policies. A modest cap may improve efficiency, or it may extend inference enough to consume similar energy and worsen the experience. Measure the complete turn.
- Route by task and risk. Simple informational turns may use a smaller model while higher-risk requests take a more capable path. Permission and safety controls must remain consistent.
- Remove idle leaks. Orphaned media sessions, unused replicas and development workloads can consume power without completing customer work.
These controls should feed the broader on-premise AI total-cost model. Electricity and cooling are only part of TCO, but a procurement estimate based solely on GPU nameplate power or cloud token price is incomplete.
Cloud, private cloud and customer-hosted trade-offs
A managed cloud service can pool workloads, scale capacity and place responsibility for facility engineering with the provider. It may therefore be the more efficient choice for variable or immature demand. The customer may, however, receive limited workload-specific evidence about physical energy, cooling or the exact hardware used.
Private cloud can offer dedicated governance and regional control while retaining managed facilities. Responsibility for energy evidence depends on the contract: the infrastructure operator may expose meters and efficiency data, while the customer still owns the workload definition and successful-outcome measure.
Customer-hosted inference gives an organisation direct control over hardware, runtime, metering and release timing. It can also strand energy in underused capacity and makes local power, cooling, resilience and maintenance part of the implementation. On-premise is not automatically greener, cheaper or faster; it is appropriate when data boundaries, sovereignty, predictable utilisation or operational control justify that responsibility.
Twelve questions for procurement and architecture review
- Where is power measured: GPU, server input, rack or facility?
- Which components are excluded from that boundary?
- Are energy and performance captured from the same run?
- What workload, concurrency and conversation duration does the result represent?
- Does success include latency, accuracy, safety, voice and rendering quality?
- What are idle, average and peak input power?
- Are gross and incremental energy per successful conversation both reported?
- Which temperature, clock and throttling signals are retained?
- Can the facility support the heat density and the required failure state?
- Is any cooling or facility multiplier measured, allocated or merely assumed?
- Which changes trigger a repeat energy test?
- Who owns optimisation and evidence in cloud, private-cloud and on-premise deployments?
Where Yepic’s experience applies
Yepic has spent years developing proprietary talking-photo and real-time avatar technology, including optimisation for commercial GPUs. Private, sovereign and customer-hosted implementations can be scoped for a customer’s own environment and GPUs, alongside cloud and private-cloud architectures where they are more appropriate.
At GAIN Saudi Arabia, Yepic operated a five-metre real-time agent targeting a response time below one second alongside the holographic Farrah across three summit days. The GAIN deployment demonstrates the multi-component, low-latency nature of a live avatar service. It is not presented as an energy benchmark or a completed customer-hosted deployment.
The practical next step is a bounded energy test: choose one representative journey, define the system boundary, synchronise wall power and component telemetry with the load run, keep quality gates active and calculate both gross and incremental energy per successful conversation. That gives facilities, architecture, finance and risk teams one evidence set they can use together.